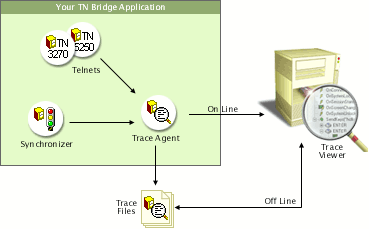
To trace a TN Bridge application you need to setup the Trace Agent built into the Trace Control.
The following steps shows you how to setup the Trace Services to work with your application:
| • | Drop a Trace control into a form. |
| • | Set the Telnet property of the trace control to the Telnet control: |
Trace1.Telnet = Telnet
| • | Set the TCP/IP listening port to the Port property (at design time or at run time): |
Trace1.Port = 1024
| • | Set the Active property to true. When doing this at design-time, the activation takes place at run-time: |
Trace1.Active = True
| • | Run your application. |
| • | Each time the telnet control connects to a mainframe, a trace file is generated with a connection identifier as its name and extension the ".hst". This file will be stored into the folder specified in Trace Directory property or in windows temporary files folder. By default, this files will be removed when the trace becomes inactive, but you can change this behavior setting the PurgeTraceFiles property to False. |

For on-line monitoring:
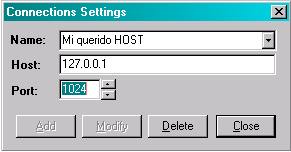
| • | Open the TN Bridge Trace Viewer and setup a connection pointing to the machine IP address where your TN Bridge application is running. Also set the TCP Port to the listening port specified in your Trace control. This is the Connections Settings dialog box where you can complete the information: |

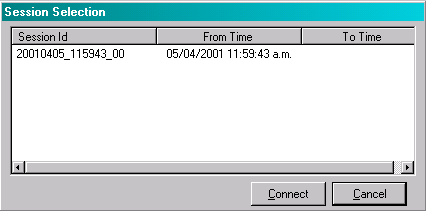
| • | Click the connect button. A dialog box with the available connections will be shown. Choose one from the list and click the Connect button. |

For off-line monitoring:
Open the TN Bridge Trace Viewer and choose the file menu and open menu item. Select the trace file previously generated by your TN Bridge application. (Remember that this file will be available only if you set the Trace's PurgeTraceFiles property to False. Also, is strongly recommended to set the Directory property to an existing a known folder).