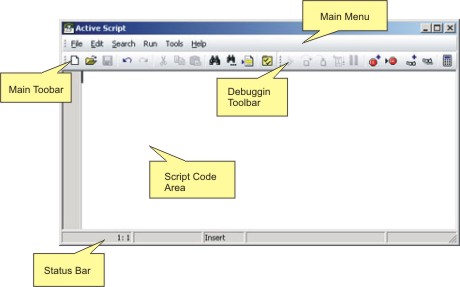
When a macro is created, it is saved as a script file that can be fully debugged using the 'Active Script' window in debugging mode. To access this mode, click on the 'Play Macro' button in the Main Toolbar and then select the 'Edit' option.
![]()

The 'Active Script' window will initially appear empty. Click on the 'Open' button in the toolbar ![]() to display a dialog where you can choose the macro file (.zsm) want to debug.
to display a dialog where you can choose the macro file (.zsm) want to debug.
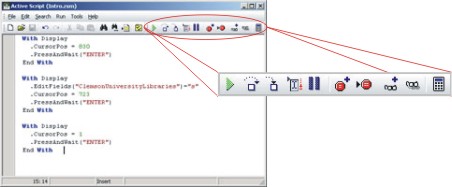
When a macro file is opened, the macro debugging toolbar will become fully enabled. This will allow you to insert breakpoints, use step-into and step-over debugging technics, add watches and also evaluate expressions.

|
Start Or Resume Execution Use this button to start or resume code execution after it has been paused. |
|
Step Over Use this button to avoid executing a procedure line-by-line and execute it as a whole. |
|
Step Into Use this button to execute procedures line-by-line. |
|
Run To Cursor Use this button to execute all preceding code to the cursor position. |
|
Pause Execution Use this button to pause code execution. |
|
Add Breakpoint Use this button to set a breakpoint in the line you are currently positioned. Execution will pause every time it reaches the breakpoint. |
|
Breakpoints List Use this button to display a list of all established breakpoints in the macro and its properties. |
|
Add Watch Use this button to add a watch so you can monitor the value of a specific variable at any time in a real-time fashion. |
|
Watches List Use this button to display a list of all active watches with their current value. |
|
Evaluate Expression Use this button to query the value of any variable at any time. |
Related Topics